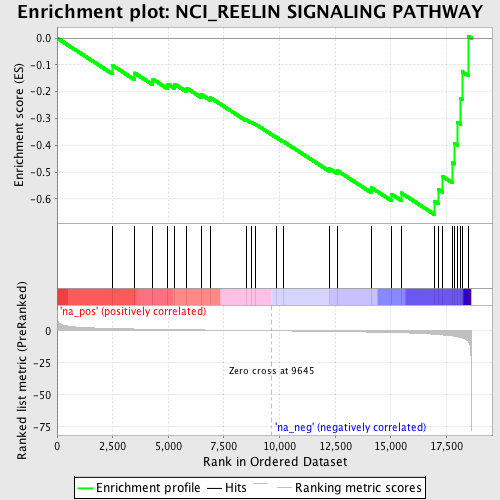
Profile of the Running ES Score & Positions of GeneSet Members on the Rank Ordered List
| Dataset | set03_wtNotch_versus_normalThy |
| Phenotype | NoPhenotypeAvailable |
| Upregulated in class | na_neg |
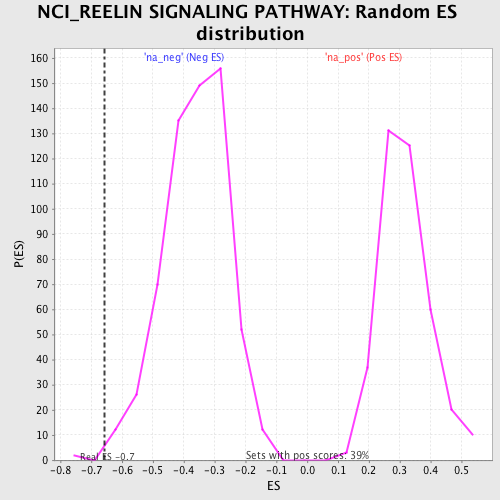
| GeneSet | NCI_REELIN SIGNALING PATHWAY |
| Enrichment Score (ES) | -0.65816504 |
| Normalized Enrichment Score (NES) | -1.8278723 |
| Nominal p-value | 0.0032573289 |
| FDR q-value | 0.08996991 |
| FWER p-Value | 0.848 |
| PROBE | GENE SYMBOL | GENE_TITLE | RANK IN GENE LIST | RANK METRIC SCORE | RUNNING ES | CORE ENRICHMENT | |
|---|---|---|---|---|---|---|---|
| 1 | MAPT | 2484 | 1.749 | -0.1016 | No | ||
| 2 | RAPGEF1 | 3484 | 1.369 | -0.1302 | No | ||
| 3 | MAP2K7 | 4298 | 1.135 | -0.1531 | No | ||
| 4 | DAB1 | 4981 | 0.975 | -0.1720 | No | ||
| 5 | GRIN2B | 5276 | 0.898 | -0.1713 | No | ||
| 6 | PIK3R1 | 5830 | 0.769 | -0.1870 | No | ||
| 7 | ITGA3 | 6494 | 0.629 | -0.2111 | No | ||
| 8 | AKT1 | 6886 | 0.551 | -0.2220 | No | ||
| 9 | RELN | 8502 | 0.224 | -0.3048 | No | ||
| 10 | NCK2 | 8725 | 0.180 | -0.3135 | No | ||
| 11 | GRIN2A | 8920 | 0.141 | -0.3213 | No | ||
| 12 | PIK3CA | 9878 | -0.045 | -0.3720 | No | ||
| 13 | ARHGEF2 | 10171 | -0.104 | -0.3858 | No | ||
| 14 | RAP1A | 12241 | -0.541 | -0.4871 | No | ||
| 15 | ITGB1 | 12596 | -0.629 | -0.4947 | No | ||
| 16 | VLDLR | 14126 | -1.021 | -0.5582 | No | ||
| 17 | MAPK8 | 15028 | -1.330 | -0.5823 | No | ||
| 18 | LRP8 | 15469 | -1.537 | -0.5778 | No | ||
| 19 | MAP3K11 | 16964 | -2.684 | -0.6090 | Yes | ||
| 20 | GSK3B | 17139 | -2.906 | -0.5651 | Yes | ||
| 21 | LRPAP1 | 17341 | -3.220 | -0.5169 | Yes | ||
| 22 | CDK5 | 17776 | -4.065 | -0.4657 | Yes | ||
| 23 | FYN | 17854 | -4.233 | -0.3923 | Yes | ||
| 24 | CRKL | 17994 | -4.686 | -0.3138 | Yes | ||
| 25 | CBL | 18150 | -5.305 | -0.2250 | Yes | ||
| 26 | PAFAH1B1 | 18207 | -5.572 | -0.1258 | Yes | ||
| 27 | CDK5R1 | 18479 | -8.062 | 0.0074 | Yes |